Step 1: Learn How to Use Spark
Introduction
As a reminder, you can follow along below by using the free Notebooks available in Qubole Test Drive. If you are already familiar with the basics of Apache Spark, feel free to skip to the next sections.
In our first step, let’s familiarize ourselves with the fundamentals of Spark. We’re going to begin with the Advanced Analytics for Retail Notebook. Feel free to follow along in Test Drive or download the Notebook to run in your own Qubole account. In this section, we will be covering:
- Notebooks
- Run your first query
- Using Schema (Hive Metastore) & RDDs
- Building DataFrames in preparation for data exploration
Qubole Test
What are Notebooks?
Notebooks are like the “Daily Prophet” newspaper in Harry Potter, where you can have interactive visualizations along with code and text. Notebooks are run synchronously, so we can transform data upfront that can be used for model training or further advanced analytics.
Qubole Notebooks offer clean visualizations to help us understand our data more easily, which we can use for things such as dashboarding or model evaluation.
Running Your First Query
We will be querying data for a fictional retail company’s purchase and weblog data that is evaluating the relative popularity of its products and the relationship between product purchases.
Spark Notebooks allow us to run a number of different languages (SQL, Scala, PySpark, SparkR, and more). We can configure the Spark Interpreter with a default language, and for any other language it will be necessary to specify each language we want to use with % + [language] at the start of the Notebook paragraph.
We begin by defining we’re using SparkSQL with %sql and then exploring a table from our Hive Metastore with a select * statement using:
%sql
select * from products limit 10
You should now see a table list of products, limited to 10 results.

Spark RDD Introduction
Qubole hosts a Hive Metastore by default, which allows us to have a persistent schema even when Spark nodes scale down. Qubole acts as the data processing platform, solving the question of cluster management and Spark’s infrastructural organization—such that identifying an RDD and querying it can be done in seconds.
To create an RDD, we will use the orders table already structured in our Hive metastore and create our partition. Given we’re using Scala here, we’ll also need to define this:
%spark
val orders = ordersItemByPName.rdd.map(r => {
r.getsAs[WrappedArray[Int]](1).mkString(“,”).split(“,”)
})
Creating an RDD allows us to partition our data in memory and execute commands against those partitions in parallel, thereby increasing the processing throughput.

Fun Fact:
Scala’s interpreter binding is named “Spark”, because it is the preferred programming language for Apache Spark due to its scalability with the JVM. While Python and R have larger user bases and more extensible machine learning tools, Scala makes up for it in performance for large and complex Spark workloads.
Spark DataFrames Introduction
In addition to RDDs, Spark offers Datasets and DataFrames to handle analysis. RDDs are typically used for application level programming and unstructured workloads where a schema or specific class declaration is not required. Conversely, DataFrames help with use cases including a schema structure and columnar or row level access to the data.
Formatted data sets (such as CSVs, ORC, or Parquet), on the other hand, offer benefits due to the serialization of the data being moved. This allows for an improvement in performance when moving large volumes of data through a cluster.

Using RDDs
Below, in our example, you’ll see importation and interaction with an RDD in Qubole’s Notebooks. (Hint: jump to “Section 4: Introduction to Spark MLlib” in the Retail – Advanced Analytics Notebook)
RDD’s are at the core of Spark’s functionality. A Resilient Distributed Dataset stores data in-memory, eliminating the need to write results to an external storage system (e.g. an alternative distributed file system). By using RDDs, Spark avoids time-consuming tasks like intensive data replication, disk I/O, and serialization while retaining a high degree of fault tolerance. This feature alone makes Spark ideal for certain iterative data processing tasks, particularly machine learning.
First, let’s group the outputs into an RDD as follows. In this case we are using product items grouped by frequency that were purchased together:
%spark
val twoProducts = model.freqItemsets.filter(_.item.length==2).map{ items=>
(items.items(0), items.items(1), items.freq)
}
Using DataFrames
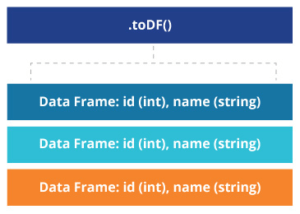
 DataFrames are a collection of data in named columns assembled from a wide variety of sources—including Hive Tables, external databases, RDDs, and structured data formats. They can be operated similarly to an RDD, and registered as temporary tables to support further querying.
For simplicity, we’ll convert the newly grouped columns in our RDD example to a DataFrame with the toDf function:
%spark
val twoProducts = model.freqItemsets.filter(_.items.length==2).map{ items =>
    (items.items(0),items.items(1), items.freq)
}.toDF("Product1","Product2","Frequency")
The Notebook confirms the conversion with the output of our new Spark DataFrame dictionary:
twoProducts : org.apache.spark.sql.DataFrame = [Product1: string , Product2: string … 1 more field]
Now we’ve created a DataFrame in Spark for the frequency of purchase between Product 1 and Product 2. How can we explore, interact, and eventually create a new table to visualize this data? Follow along to the next section to see how we can visualize our data and create dashboards with Qubole Notebooks.


