“If you are a cloud adopter rapidly adopting cloud services, but not developing the finance governance muscle, you will certainly be visiting the cloud optimization circus frequently,” says Subbu Allamaraju, Expedia Group, in his blog “Cloud Optimization Circus”. Comparing cloud optimization exercises while going to a circus, Subbu provides details of the problems faced by many such customers and lists out the solutions required. These are things that have been echoed by several Qubole customers as well who have successfully adopted the cloud for Big Data processing. With “Financial Governance for Big Data in the Cloud” being one of the cornerstones of the Qubole value proposition, we decided to do something about it.
Introducing Qubole Cost Explorer
Today we are glad to announce Qubole Cost Explorer. Qubole Cost Explorer (QCE) allows you to monitor, manage, and control costs by providing granular visibility of your infrastructure spending at a job, cluster, or cluster instance level. With cost explorer, you can track costs, monitor show back, justify business plans, prepare budgets, and build ROI analyses.

So what makes Qubole Cost Explorer Standout
Most of the stand-alone cost management tools that are available today provide cost information only at the service level. This is not only limiting but results in extra manual work since attributing costs at the individual user or job/workload level requires setting up a single-tenant infrastructure (clusters). While this architecture could provide visibility into job and user-level costs, it is a very expensive solution. An alternate approach is to use multi-tenant clusters—where multiple users and jobs share the same cluster—as they provide statistical multiplexing gains. However, since costs can only be tracked at the cluster level, spending visibility at a user or job level becomes a cumbersome and time-consuming manual effort or gets obfuscated.

Qubole Cost Explorer solves this problem and eliminates the need to trade off or compromise on TCO for the purpose of attributing the cost to people or applications.
How Can Qubole Cost Explorer Help You?
Qubole Cost Explorer can help you avoid visiting the cloud optimization circus frequently. QCE provides data that can help you build the essential blocks of effective Financial Governance.

Build ROI Analysis:
Through job-level cost attribution, QCE can provide insights into the “investment” part of the ROI calculation. Before being consumed by downstream applications such as reporting, dashboarding, or ML models, data goes through several stages of the pipeline. Each stage of the pipeline consumes a portion of the overall investment. Hence, to calculate the overall investments for a particular application, it’s important to aggregate the cost across all these stages.
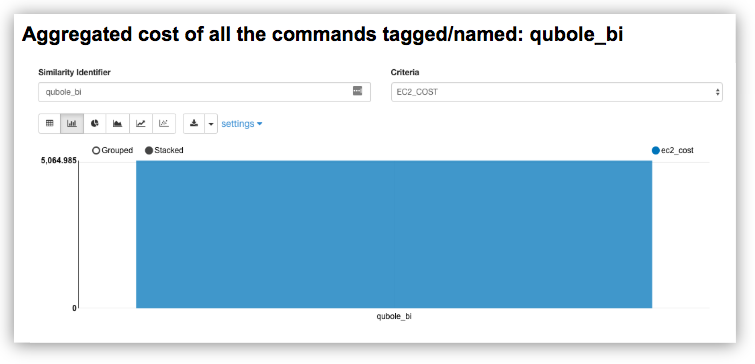
QCE for job level attribution aggregates the overall cost based on the job name or tag and the specified time duration. For instance, all of Qubole’s jobs that power our business analytics (from data integration to data visualization) across the pipeline, are tagged as qubole_bi. With QCE, we consolidate this cost in order to evaluate the ROI of this entire use case.

Plan and Budget:
With the job and user level cost attribution through QCE, customers can now go beyond the cluster, and actually, look into the workloads that are driving the consumption to project and track spending. For instance, in the same workload (qubole_bi) described above, the spend was observed for the first 12 days of the month and projected for the rest of the month. This projection was then used to compare against the actual consumption for the rest of the month.

Monitor Showback:
QCE provides cost attribution at the user level across multiple dimensions: aggregate, by command source, command type, etc. With this information, you can then map the users to their teams of business units to monitor the show back.

Justifying Business Cases:
A sound financial governance practice requires frequent operational reviews on the steps taken to control costs measured against the eventual outcome: savings realized. QCE makes this data readily available, such as savings from using AWS Spot Instances as part of Qubole clusters.

How is QCE Delivered?
QCE provides the flexibility and self-service querying capabilities that our data-savvy customers expect from Qubole, allowing users to generate custom insights above and beyond the packaged metrics delivered in QCE.

QCE data is directly ingested into a customer’s data lake, and available for self-service querying through materialized tables. Customers can configure their own lifecycle policy on QCE data, and transfer it to cheaper storage for archival. In addition to this, sensitive data such as Cost and other billing information requires appropriate data access policies. Customers can leverage the comprehensive suite of data governance, security, and privacy-related capabilities and configure their own data access policies.
How can you use QCE?
The effectiveness of any analytics application depends on how easy it is to access and readily available. To facilitate this, QCE provides multiple interfaces to access the data.

Out-of-Box Qubole Notebooks/Dashboards
Pre-built dashboards are uploaded as Notebooks to a customer’s Qubole account to kickstart the analysis. These Notebooks allow users to interact with the dashboards and further slice and dice the data based on multiple dimensions.
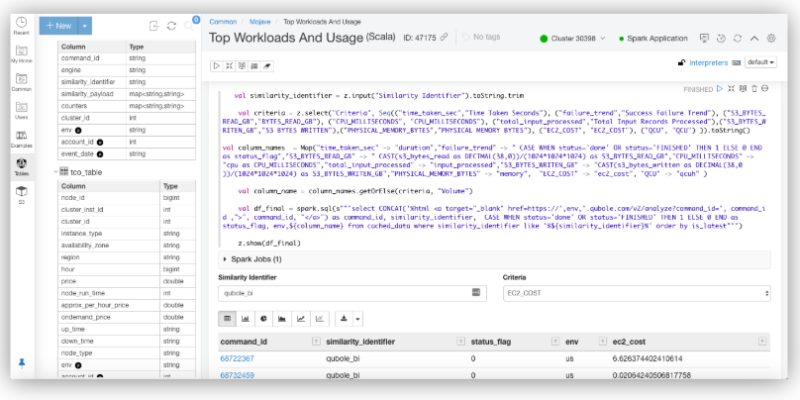
Users can also clone and customize these Notebooks for their specific needs. For instance, I was able to clone one of the notebooks that provided me Job level cost for the workloads tagged as qubole_bi and build a simple linear regression predictive model to project the AWS EC2 spend (EC2$) and observe it against the actual consumption. Since all the required tools – processed data, notebooks for building the models, SparkML for the libraries, and Spark cluster to run this model, were readily available, the time to generate a custom prediction was less than 5 mins.
Interactive SQL Queries through Qubole SQL Workbench:
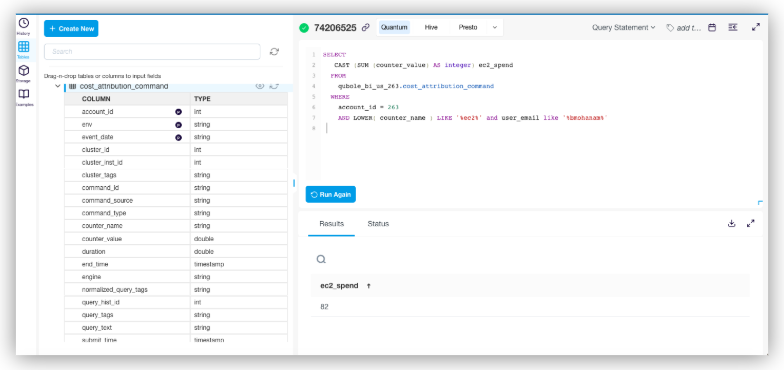
On the other hand, users who are interested in ad-hoc insights into the QCE data can also leverage Qubole SQL Workbench to query this data using Hive, Spark, or Presto on Qubole. The availability of QCE data tables and columns right next to the SQL Composer makes it easier to perform any ad-hoc data exploration.
BI Tools:
With materialized tables, and the recently announced named connector for Tableau, creating custom QCE dashboards with (Tableau, Looker, and other popular BI tools) for business users, is only a fingertip away.
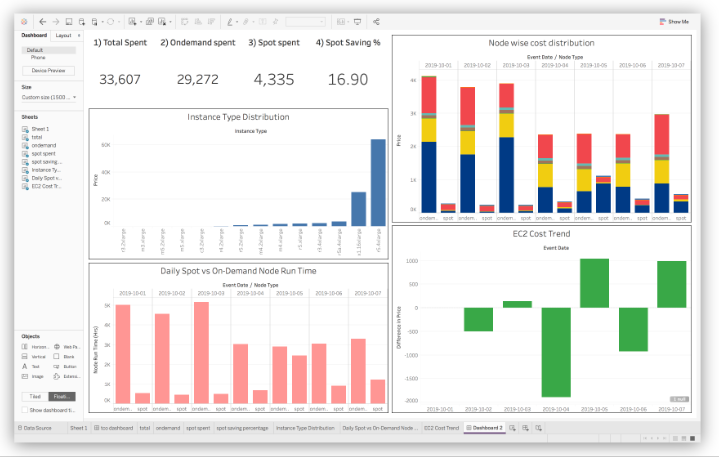
Qubole SDK for Custom Applications:
Depending on business priorities, organizations have their own needs and requirements with a cost analytics service. This, in turn, results in several custom applications that need to be built on cost data. QCE activates all of these custom application use cases, by transferring the data ownership and storage to Qubole customers. For instance, to proactively monitor the cost consumption of our clusters and to take mitigation steps, our BI team has built an alerting mechanism using operators in Apache Airflow on Qubole, which periodically computes the EC2$ cost at the cluster level, and sends a notification/alert once the value crosses a certain threshold. This automatically alerts the Qubole admin through email, who can then take the necessary action.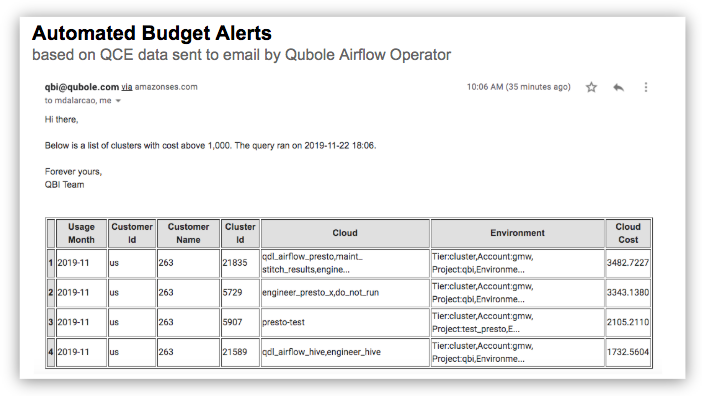
Conclusion
Qubole Cost Explorer provides enterprises with a financial governance solution to monitor their workload spending with pre-built and customizable reports and visualizations. Data teams now have a clear view of their cloud infrastructure costs for all their data processing and analysis jobs, and can effectively manage, control, and reduce them—regardless of the lifecycle stage or bursty nature of typical analytics and machine learning use cases.
To learn more about Qubole Cost Explorer, watch the real-world use case webinar here, or download the datasheet. You can set up a time for the Qubole Cost Explorer demo by contacting us here.
Sign up for a free 14-day trial to experience Qubole live.
