Two key criteria that everyone looks for in a query engine for interactive analytics are performance and cost. You want best-in-class performance to meet the short deadlines of interactive workloads, while at the same time desiring a solution that reduces TCO.
Presto is the go-to query engine in Qubole for interactive and reporting use cases due to its excellent performance. And when it comes to cost, AWS Spot nodes have time and again proven to be the highest cost-saver feature for our customers, providing EC2 compute for discounts as high as 90 percent. Spot nodes are the excess capacity available in AWS EC2 to users at a highly discounted price — but with the catch that a Spot loss event can occur any time (i.e. AWS can take back the Spot nodes with only two minutes’ notice).
Combining Presto and Spot nodes seems like an obvious choice to build a highly performant and economical solution — but Presto and Spot nodes do not work well together. Highly efficient implementations and design choices like in-memory execution and pipelined stage execution make it possible for Presto to run as fast as it does today. However, these same features also prevent Presto from leveraging Spot nodes. In this blog post, we will explore how Qubole allows our customers to get the best of both worlds by looking at:
- What this Presto features really mean
- Why do they prevent Presto from leveraging Spot nodes
- What Qubole has done to make Presto work well with Spot nodes
What Is In-Memory Execution and Pipelined Execution?
During query execution, Presto reads or generates a lot of data. The tasks reading data from a source will retain this data for a short period, while the tasks of intermediate stages will generate some output that they will retain for potentially longer periods for other tasks to consume. All such data in Presto is maintained in memory and not persisted on disks. This is different from Hadoop’s behavior, as Hadoop map tasks write the data to a local disk and the reduced tasks write their generated data in HDFS. Presto saves a lot of query time by avoiding disk latencies and keeping all of this data in memory.
The above description of keeping all data in memory is highly simplified: if Presto were to keep all data in memory all of the time, then it would not be able to work with big data use cases where terabytes of data are processed in a single query (and processing at petabyte scale is also not unheard of). Presto tries to break this data into smaller segments called “Pages” and streams each Page in memory from one task to another as soon as possible to keep task memory usage low.
For example, if a query is broken down into three stages — Reading > Processing > Output — then Pages of data flow from the Reading task to the Processing task, which processes that data and generates Pages as the output, which are then streamed to Output tasks. Therefore, it is possible that partial output is generated while the reading of other data is in progress in parallel. This is called Pipelined Execution of tasks; it keeps the memory usage of tasks low by quickly consuming output and speeds up queries by allowing the overlapping execution of multiple tasks, thus exploiting parallelization to the fullest.
While both of these features are an important and integral part of Presto, they have a downside when it comes to leveraging Spot nodes. Because the data is in the memory of the nodes, any node loss event leads to the loss of that computed data — which causes query failures. Since the stages are pipelined, it is not possible to simply checkpoint at stage level and restart from a previous stage. As a result, task- or stage-level recovery is not possible right now in Presto.
By choosing these features, Presto sacrifices reliability over performance. At the other end of the spectrum, Hadoop sacrifices speed for reliability by writing checkpoints to disk. These choices for Presto and Hadoop make sense because the use cases they cater to are different (interactive versus batch). As a result, Presto is very sensitive to node failures and cannot leverage Spot nodes (which can go away at any point in time). Today, our customers who use Spot nodes with Presto use them with the knowledge that queries can fail and they must re-run those queries manually.
Uniting Presto and Spot Nodes
Pipelined stage execution and in-memory execution are important performance features in Presto, and Spot nodes usage in Presto is also increasing (as seen in the 2018 Qubole Big Data Activation report, 30 percent of all Presto nodes in Qubole are Spot nodes and the number of Spot nodes spun up increased 4x year-on-year). Given these trends, Qubole sought a way to provide reliability even around the node loss events while continuing with the current design of Presto. In the following sections, we will discuss how we have enabled Spot node usage in Presto clusters without sacrificing reliability.
Handling Spot Termination Notifications
AWS issues a two-minute notification before taking the Spot node away. We run daemons on each Spot node that listens for this notification and inform the Presto master node about any impending losses. Upon receiving this information, the Presto master quiesces the node that will be lost (i.e. blacklists this node from the active nodes list so that no new work is assigned to this node).
Separate from this, the Presto master also adds a node after receiving notification of the Spot loss to ensure that the cluster size remains stable. This additional node can be an on-demand node if fallback to on-demand nodes is enabled by the user and procuring a new Spot node is taking too much time. Introducing an on-demand node may give the cluster a better chance to re-stabilize its size before or soon after the Spot node is lost. This on-demand node will soon be replaced by a Spot node using the Presto Spot-Node rebalancer, which determines when the percentage of Spot nodes drops below the desired value and in response replaces on-demand nodes with Spot nodes until the desired percentage is met.
Although quite short, the two-minute window is long enough for a majority of the interactive queries to succeed. As long as the work in progress on the Spot nodes that will be lost finishes in under two minutes, the queries will be unimpacted.
Finishing the assigned work is possible for the leaf stages — those that involve reading data and streaming to intermediate nodes — as they usually have simple compute logic and finish quickly. However, it is difficult to finish assigned work for the long-running intermediate stages, which process input data and maintain state for a long time (e.g. grouping operator). In the next version, we plan to add node type–aware scheduling where Spot nodes are responsible only for the leaf stage’s work and not the intermediate work.
Smart Query Retries
Even with the Spot termination handling described above, there are still chances for queries to fail due to Spot loss. This loss can occur due to intermediate stages taking a long time, or even leaf stages taking a long time and the node terminating before completion of processing.
For all such cases, we need a query retry mechanism that is smart enough to decide if the query can be retried and, if so, determine the right time to retry the query to improve its chances of success. To this end, we have built the Smart Query Retry Mechanism inside Presto Server that fulfills the following requirements:
- Query retries should be transparent to clients and work with all Presto clients: Java client, JDBC Drivers, Ruby client, etc.
- The retry should happen only if it is guaranteed that no partial results have been sent to the client.
- The retry should happen only if changes (if any) caused by the failed query have been rolled back (e.g. in the case of Inserts, data written by the failed query has been deleted).
- The retry should happen only if there is a chance of successful query execution.
We made the Presto server responsible for query retries as opposed to clients for two reasons:
- The Presto server offers a single place to have retry logic rather than replicating it in each client.
- The server has much better insights into the state of query that is needed for a few of the requirements described below.
In the following sections, we will see how the aforementioned requirements are met in implementation.
1. Transparent Retries
Transparent retries imply that no changes should be required on the client-side for retries to work. All Presto clients submit the query to the server and then poll for status in a loop until the query completes. The Presto server will internally retry the query as a new query in case of failure, but the client should continue with its polling uninterrupted and eventually should get the results from the new query.
The trick to make this work is to change the `next_uri` field in the Presto server’s response to a client poll request. The ‘next_uri’ field tells the client what URI to poll in the next iteration to get the status of the query. Changing this field to point to the new query instead of the original query redirects the client to the new query without any changes to the client.
2. Retry Only When No Partial Results Have Been Returned
As described earlier, Presto can make partial results available to clients while the query is still running due to pipelined execution. Retrying a query when partial results have already been processed by the client would lead to duplicate data in the results. This is a difficult problem to solve, as storing the state of results consumed by a client can be very difficult.
For this, the INSERT OVERWRITE DIRECTORY (IOD) feature of Qubole comes into play. In Qubole, all user queries are converted into IOD queries and write their data to a directory. Clients get the results only after the query has completely finished. This gives us the flexibility to delete partially written results in the directory and start over for the retry, ensuring no duplicate results will be returned to the client.
In the future, retries will be extended to SELECT queries provided the query has not returned any results before failing.
3. Retry Only If Rollback Is Successful
Blind retry of a failed insert query can lead to duplicate results (as described above), as some partial results may have been written before the query failed. To solve this issue, the Query Retry Mechanism tracks the rollback status of the query and only initiates a retry once the rollback is complete. Only the Presto server is privy to this information about the rollback status as well as information about the retry mechanism, which also sits inside the server.
4. Avoid Unnecessary Retries
Retrying in cases where the query would fail again will only lead to resource wastage. For example, retrying a query after the cluster size has shrunk from a failed query due to resource shortage would definitely lead to additional failed queries. The retry mechanism is made aware of the query failure codes, the cluster state in which the query failed, and the current cluster state at which the retry is being considered. Using this information, the mechanism can make informed decisions on whether to retry the query or not.
Query Retry Mechanism Evaluation
We enabled the Query Retry Mechanism in one of our services and analyzed the impact over a period of two months. This service is composed of several Presto clusters in Qubole that are running a mix of on-demand nodes and Spot nodes. A lot of metadata was collected over this period from the service including commands run, their status, the errors in case of failures, events like Spot loss and query retries, etc.
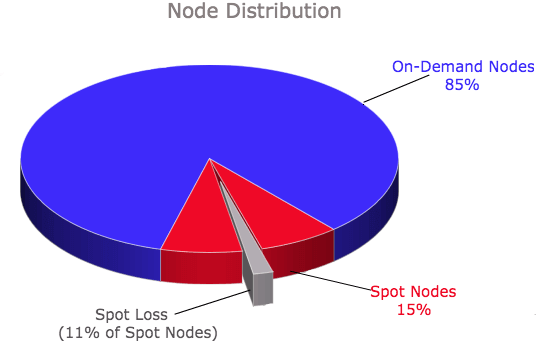
For various reasons, this service uses a higher minimum number of nodes (which by default are all on-demand nodes in Qubole) and uses Spot nodes only on the autoscaled nodes that comprise only 15 percent of the overall number of nodes in the cluster. The node-type distribution from the collected information looks like this:

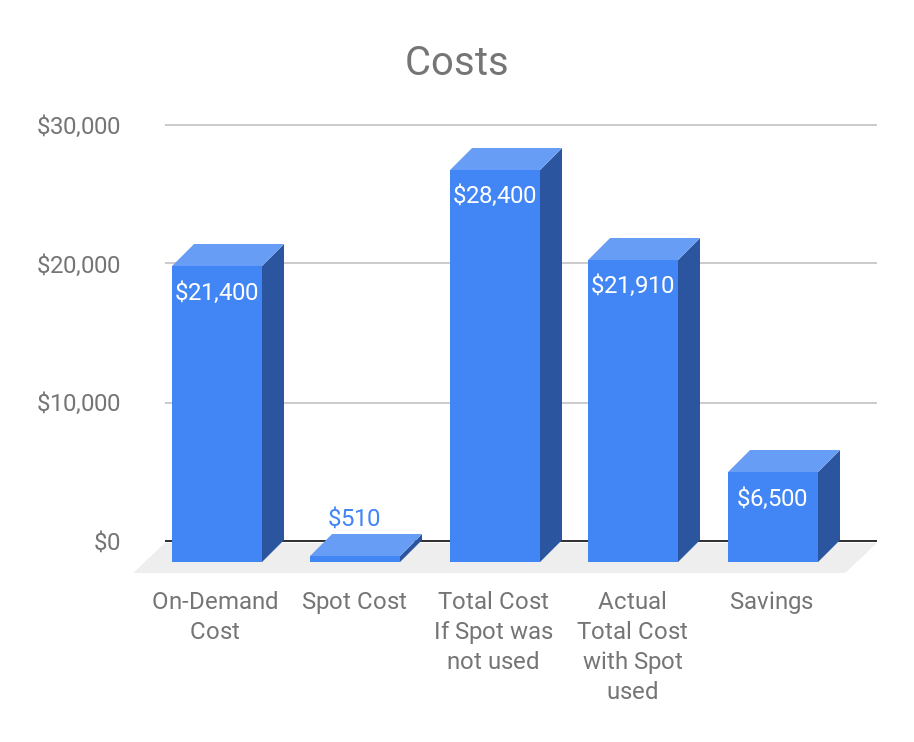
This converts to the following cost graph:

With just 15 percent of the nodes as Spot nodes, we have saved approximately 23 percent on our costs. This is a substantial amount and could be passed on as a benefit to end-users by increasing the cluster size for better performance if need be. Typically our customer clusters comprise a much higher percentage of Spot nodes (close to 40 to 50 percent); hence their savings are usually a lot higher.
As seen in the node distribution chart, we also saw that approximately 11 percent of the Spot nodes were lost. This implies that if there were queries running during the period, the occurrence of Spot losses should have triggered the Query Retry Mechanism. Let’s drill down to see how much the mechanism actually helped.
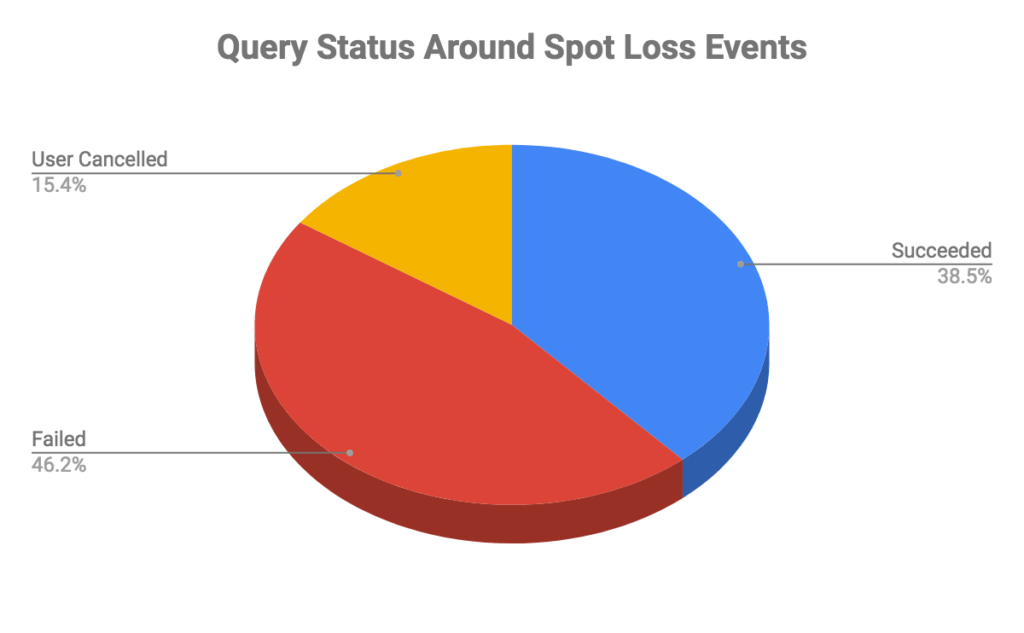
First, let us look at the status of queries that came around any Spot loss event, i.e. queries that were submitted before a Spot termination notification was received and finished 110 seconds after the notification (considering the termination notification is received around two minutes before Spot loss):

The chart reveals quite a lot of failures, but digging deeper reveals these were legitimate failures due to various reasons like Time Limit exceeded, data errors, etc. However, there were a few queries that failed even after the Query Retry Mechanism kicked in. These queries were unlucky to see multiple Spot loss events and eventually ran out of retry attempts.
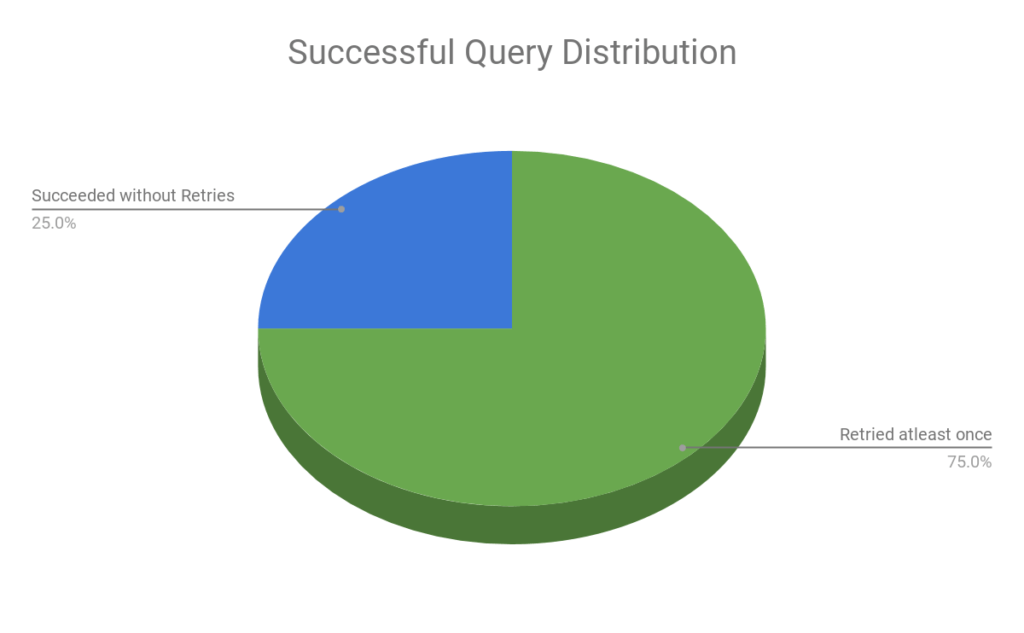
The more interesting statistic is the contribution of the Query Retry Mechanism in the successful queries:

This chart shows that the Query Retry Mechanism played a major role in query success, as 75 percent of the queries that succeeded even after node loss had at least one retry associated with them.
Thus, with the Query Retry Mechanism in place, we are able to achieve substantial cost savings while maintaining the reliability of our Presto servers.
Conclusion
With the Query Retry Mechanism, we have a system in place that provides an opportunity to now aggressively leverage Spot nodes in Presto. Apart from enabling Spot usage, the Query Retry Mechanism also improves user experience with Presto autoscaling that dynamically adds and removes nodes in Presto in response to query performance. Many times we see customers start a cluster with a misconfigured minimum size that is too low for their workloads. As a result, initial queries that come up in the minimum-sized cluster trigger upscaling; but because provisioning new nodes and getting them ready could take some time, these queries might fail due to resource shortage before the new nodes can join the cluster. With the Query Retry Mechanism, we are able to catch such cases and retry them transparently for the user.
The Query Retry Mechanism can potentially result in significant cost savings, and we will gradually roll this mechanism out to all Qubole customers. Check out our Query Retry Documentation for details on how to enable this feature and the advanced configurations for it.


