Big Data Use Case – Pattern Recognition
- Home >
- Big Data Analytics

E-Commerce businesses and retailers with an online presence operate in a competitive and fast-paced environment dominated by price and online advertisements. Conventional approaches are fragmented with individual analytics tools for separate data sources and information needs. Bringing the data together, if at all, is typically done with a manual, human-driven process. Decisions are consequentially suboptimal because of the volume, variety, and velocity of data. These are the foci of Big Data where it promises superior, data-driven results. This article describes the typical challenge and technologies to address them to guide businesses in the strategic decision on adopting Big Data.
Pricing and Advertising
E-commerce companies find themselves in a promising and challenging situation at the same time. E-commerce is growing overall yet the competitive pressure is significant since it is a scalable business and the winner takes it all.
Customers are not loyal and mostly arrive from search engines and online advertisements. On search engines, they typically are presented with multiple search results including prices, which puts pressure on margins. At the same time advertisements on these search engines are sold through bidding and leave decreasing inefficiencies in the market to be exploited.
The core challenges for an online retailer are threefold
1. Which products should I stock
2. Which price should they sell at
3. What advertisement campaigns will be most efficient?
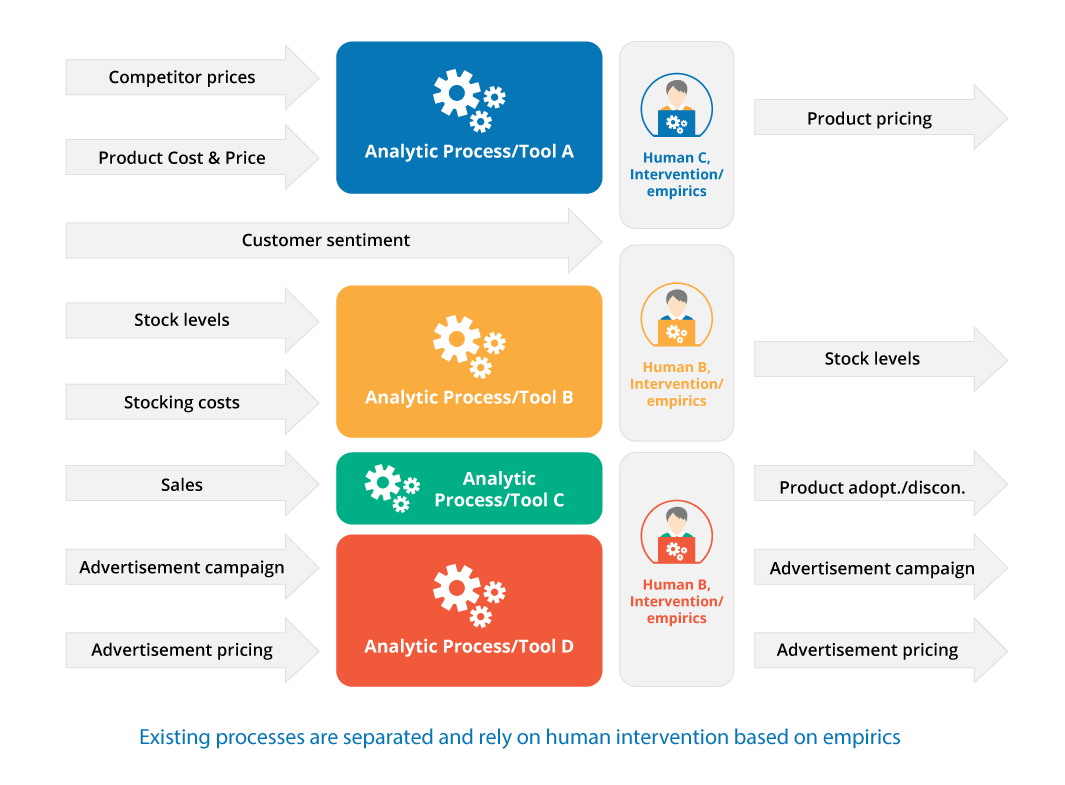
Traditionally, businesses developed independent processes for single or directly related information needs like advertising campaign selection and advertisement pricing. These fragmented processes commonly are the results of distinct primary data sources and analytics tools, and functional segregation of processes based on organizational structures. Usually, these processes require a ‘human touch’, i.e. manual intervention based on empirics that in some cases are merely innate to a single person’s experiences and exposed to their natural bias.
A modern, data-driven approach to these problems require a combination of data sources and flexible, easy to develop, manipulate, and maintain data processing steps as well as true historic data collection to employ unbiased data-driven decision.
Data out
The first step is to define what outputs a data-driven approach should provide to address the mentioned challenges. Common ones are product pricing, advertisement campaigns and pricing, product adoption and discontinuation, and stock levels, e.g.:
Which prices should be lowered to compete or sell off stock and similarly which prices can be successfully raised to increase profits? For E.g. where is the competition charging less than you and where do you underbid your competition by a disproportionate margin.
Which keywords should be invested in and what is the limit to selling products profitably? E.g. identify relevant underpriced product relevant keywords and ignore highly competitive ones.
Which products should be abandoned and what is trending? E.g. find end-of-life products like outmoded TV technologies and conversely future top sellers.
Which future stock levels are most effective? E.g. considering social media trending, season, and sales data.
Knowing these requirements we can suggest candidate data sources that have supporting data that is likely correlated with the sought-after output. These have to be integrated before we can define any data processing steps to compute the output.
Data Sources
E-commerce business has numerous data sources to consider when it makes decisions on how to set a price and compete for advertisement space. The data sources vary in type and subsequently until recently, were difficult to integrate. Relevant data are competitor offers, product cost and price, stock levels and stocking costs, sales, advertising campaigns and prices, customer sentiment, and sales data.
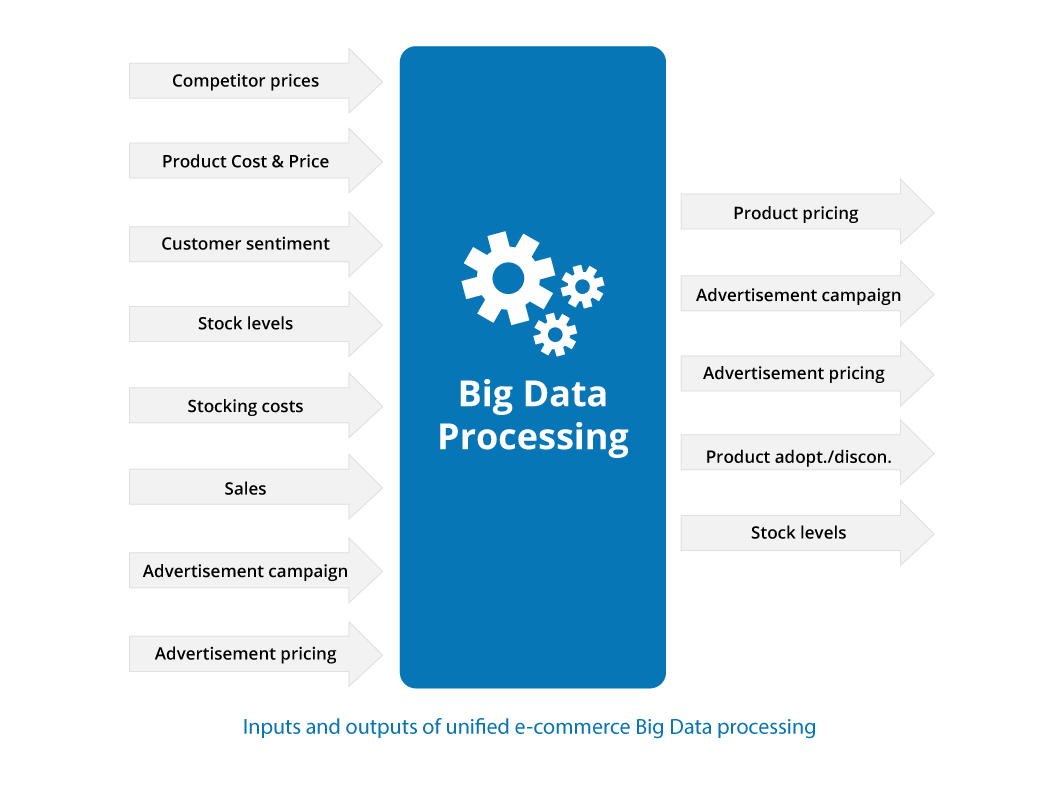
The different data sources are available in a number of forms and require a varying level of effort to integrate:
* Competitor offers can be obtained through services like price comparison websites that may sell datasets stored as files or via API access. Alternatively, crawling services or programs can regularly retrieve data for analysis. The resulting data will be either in a text format, e.g. JSON or CSV, or in a database. Either SQL or NoSQL stores can be utilized with the latter being more scalable for large-scale data sets.
*Product cost and price, stock level, stocking cost, and sales usually are available in a business’s SQL data store or can be derived from information in it. Smaller businesses work sometimes with Excel and CSV files.
*Advertisement campaign and pricing data can be collected through APIs from the providers (and then stored in text files or databases) or exported as text files.
*Customer sentiments, often only available anecdotally to persons involved in the analytics, can be captured in statistically relevant data sets from social media. The data can be collected raw, e.g. Tweets, via APIs and then processed and stored. Alternatively, services may be used to receive aggregated results, potentially already sentiment scored. Again depending on the service, the data may be available as text files or from APIs (and stored in databases if desired).
The variety and complexity of the problem appear overwhelming. There are patterns emerging though. Usually, data becomes available from three source types – SQL, NoSQL, and (text) files. Processes transfer data that is available through APIs commonly into one of the three sources. APIs are excellent for fast queries returning small amounts of data they seldom are made available and are useful for high throughput data processing.
The limited number of data source types reduces the Big Data processing challenges of integrating three types of data sources, domain-specific processing, and loading the processing results back to one or several of the data store types. The processing pattern is familiar from data warehouse ETL (Extract, Transform, Load) processing.
Big Data Processing simplified with Data Services
The discussion so far focused on the data input and output without defining the processing steps. The technologies available are numerous and perplexing when not put in the context of a use case. At the core of big data processing stands Hadoop as a platform for scalable, inexpensive processing. Hadoop processing traditionally was Java map-reduce programs, which are intricate and verbose, and integrating multiple data sources resulted in significant development effort and costs.
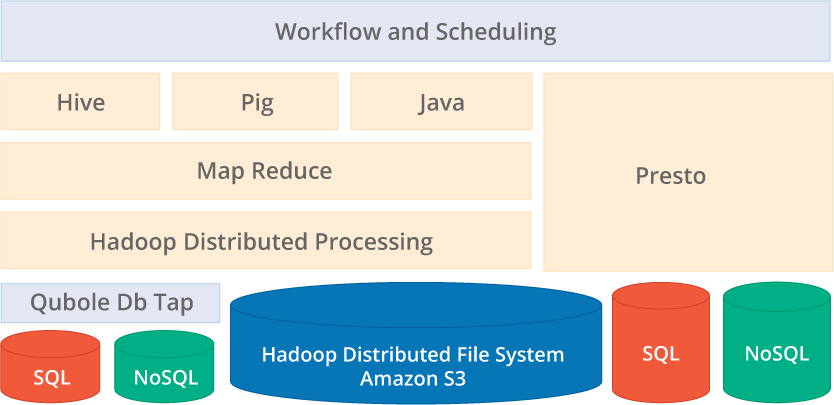
Big Data processing technologies with Hadoop
Today, an ecosystem on top of Hadoop simplifies the majority of data processing and data source integration significantly. Subsequently, many Big Data use cases do not or very rarely employ custom-written Java map-reduce programs. Software services furthermore remove the operational burden of Hadoop and its ecosystem providing ready-to-run, pay-as-you-go solutions. These as-a-Service offerings reduce Big Data projects by integrating the data stores and designing/programming efficient, concise, high-level data processing steps and workflows.
There are four typical questions customers ask when faced with the complex Hadoop ecosystem and big data projects like the e-commerce example:
- How to integrate multiple data stores?
- How to ETL the diverse data?
- How to explore big datasets?
- How to do advanced data processing?
The rest of the article will put the commonly used tools into perspective to these questions to give a high-level understanding of how to employ Hadoop for Big Data processing.
How do integrate multiple data stores?
In our use case, we highlighted numerous data sources all of which are likely physically represented as either SQL, NoSQL, or files. These stores may be in-house or located in the cloud.
SQL data stores are the workhorses used in nearly every business today, e.g. for transactional and highly-structured data. NoSQL stores are commonly employed for highly scalable time series, data without or with evolving schema, or simple key-value data. The intricacy of integration of these data sources with Hadoop varies from case to case and typically required expert knowledge. The result was costly and complex integration projects.
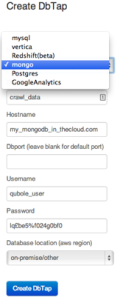
Qubole’s DbTap simplifies data source integration to a single webform
Qubole has solved this challenge by providing a shared data abstraction layer for its data services. Data sources can be integrated easily through a simple web interface and are then available to all Qubole services as a so-called DbTap. Databases like MySQL, Postgres, Redshift, MongoDB, Vertica, and even Google Analytics can be used with DbTap. The one-time setup requires basic information like database, hostname, port, username, password, and location (which can be in the cloud or on-premise). From that point on the data can be easily accessed and queried by Qubole’s big data services.
How to ETL the diverse data?
At this point, Qubole DbTaps connected the SQL and NoSQL stores to their data services. The next step is transforming and loading the data like sales, cost and sales prices, stock levels, competitor prices, and advertising data. One possibility is a de-normalized combination of all these data points into a product-based time series, i.e. for every day and product combine all the information. The data could be stored in a Hive table on Hadoop’s filesystem or S3 for example with partitioning and/or by date or product category, or by-product, depending on the access patterns. In fact, if beneficial, multiple copies, partitioned differently can be stored. One benefit of Hadoop’s file system is the inexpensive data storage and fast sequential processing which is achieved by avoiding indexing and using de-normalized, even duplicated data when required. Alternatively, the data could be stored in scalable NoSQL stores that integrate with Hadoop like HBase, MongoDB, or Cassandra to name a few.
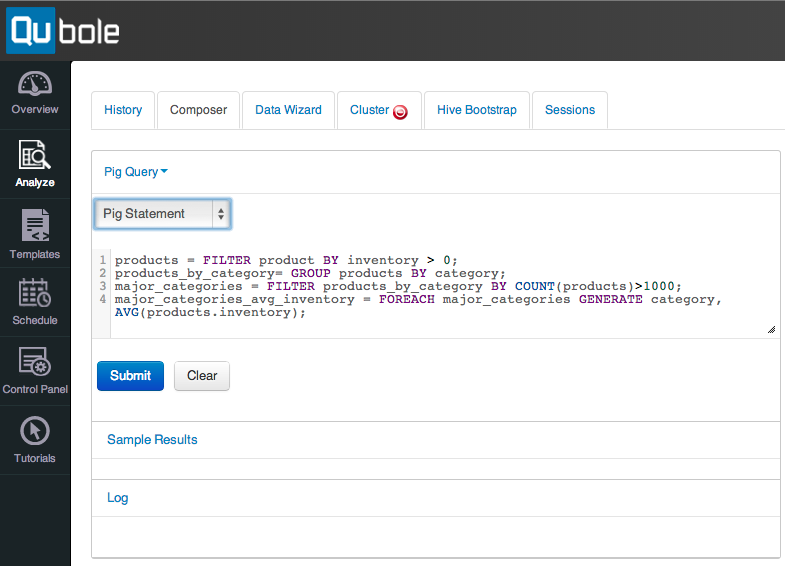
Pig is concise, easy to learn, and simplifies Hadoop driven ETL
The tool of choice to transform and load the data is Pig. Pig turns scripts written in its language Pig Latin into map-reduce jobs and executes them with Hadoop. Pig Latin is a procedural high-level scripting language, which removes the verbosity of Java and the complexity of traditional map-reduce programming. Programmers can focus on the task at hand, e.g. extracting, transforming, and loading data, without being distracted by low-level implementation details. Pig adds many advantages, e.g. Pig scripts can easily be developed in a test-driven fashion and Pig provides simple yet powerful means of adding functionality through user-defined functions.
The pig as a Service is part of Qubole’s data services and Qubole provides an easy-to-use web interface to write and execute Pig scripts. Importantly, the data sources and destinations defined in the DbTabs are available from within Qubole’s Pig service.

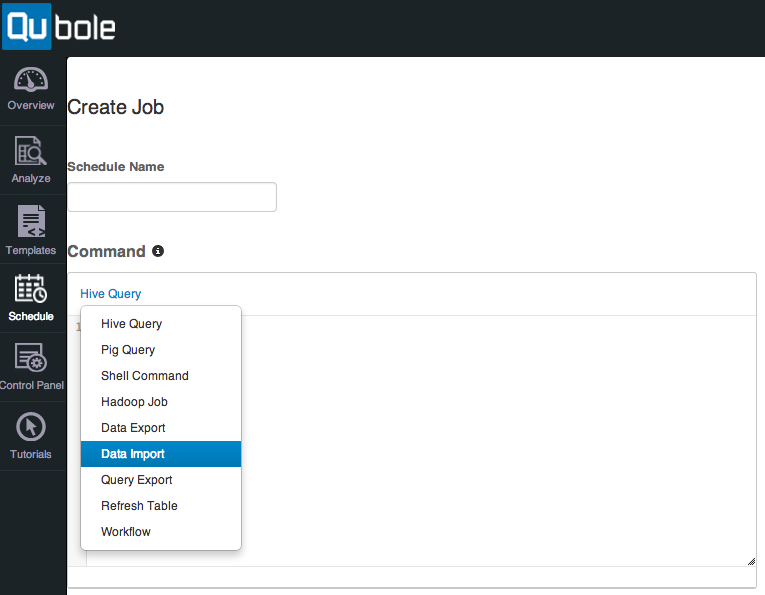
Qubole job scheduler interface
Once the scripts for loading the data and merging it are in place they usually are executed regularly. The Hadoop ecosystem provides some tools that address this functionality though they all are involved and complex. Qubole developed a web interface to simplify the scheduling of data processing. The schedule interface can be used to set up regular jobs based on Hive or Pig queries, shell commands, Hadoop jobs, and data import and export tasks. The latter two are abstractions that make importing data, e.g. product data from a NoSQL DbTap and sales data from a SQL DbTap, and exporting data, e.g. future optimal stock levels to a SQL DbTap, as simple as filling out a web form. The user has to do little more than pick the source and the destination of the data and when/how often to import/export the data.
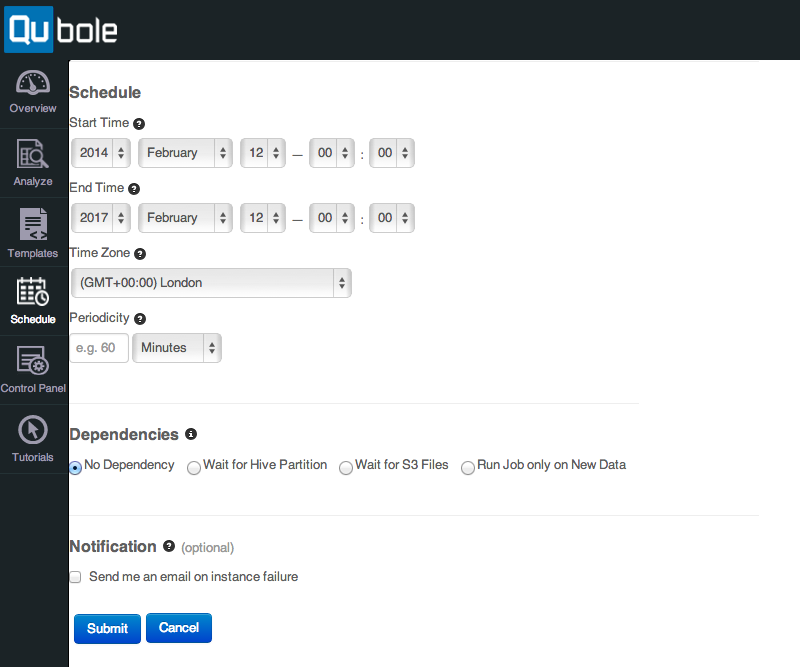
The Qubole interface simplifies scheduling data jobs
Qubole also supports the ability to run jobs depending on data arriving on S3, in a Hive partition, or only on new data, This is a significant feature for complex, fanning out, and fanning in of data pipelines. For example, we might schedule a daily job that imports sales data. After the data import is finished, i.e. a new Hive partition for the day has been created in a (Hive) sales table, we want to start other data pipeline steps, e.g. to compute future stock levels and advertisement campaigns. These jobs can be scheduled to run every time a new day partition appears in the Hive sales table. This reduces the complexity and makes the data pipeline flexible since subsequent jobs depending on data imports and computations are dynamically started when the data is available. It decouples them from brittle timing and avoids errors from unexpectedly slow or fast processing due to changes in data or architecture, i.e. scaling the cluster.
Lastly, complex workflows that require more than one Hive, Pig, Shell, Hadoop, data import, or export command can be combined in workflows, which can execute a combination of different commands. This is useful for ETL jobs that have a single input and output with minimal transformation. This, for example, could be the loading and filtering of log files from S3 and storing the structured result in a NoSQL DbTap.
How to explore big datasets
Eventually, all data sources are connected with DbTaps and the basic ETL processes are in place to replace the originally segregated data processing steps in one data pipeline. At this point many customers employ regular, scheduled imports to generate merged, core master-data-like sets. This has the advantage of having one (or only a few) data sets in a de-normalized form available on fast storage for Hadoop processing. These are typically distributed file systems like HDFS or S3 that are well supported by Hadoop or horizontally scaled NoSQL stores are able to service the large-scale, distributed reads and write Hadoop generates. Against these data sets the transformations and exports are run. The master-data concept helps synchronize outputs from separate processing pipelines, i.e. that they work off the same data and results are not disjunct.
The primary benefit of building a central data hub with one view of the data of the business is the increased analytical potential by correlating all facts across the business and time. The opportunity of the analytics, however, depends, besides the data availability, on the tools available to engage with the data. The most widely used skill in this respect is SQL (Structured Query Language). SQL on Hadoop has been a hot topic because of this combination of affordable large-scale data processing and available skill in businesses. This unlocks the complete data set to business users removing their dependency on developers and limited aggregated data sets. Two tools have emerged as cornerstones of SQL on Hadoop, Hive, and Presto, both developed at Facebook exactly for this purpose.
Hive is a mature technology and has been available on Hadoop for many years. The founders of Qubole developed Hive when they worked at Facebook and subsequently Hive is a first-class citizen in the Qubole service ecosystem with many unique optimizations only available on Qubole. Hive converts SQL queries to map-reduce Hadoop jobs executed against DbTaps represented as tables by Hive. Hive, due to its design around map-reduce, can therefore process any size data with SQL queries and is used at Facebook to process Petabytes daily by thousands of users. Hive is only limited by the turnaround time of queries which usually take minutes to hours to complete depending on cluster and data size. Hive consequently is an ideal tool to run complex queries on large datasets where results are not expected immediately. This is useful for parts of the ETL processing or for data-heavy analytics where large datasets have to be explored.
Recently, the gap of real-time SQL querying has been closed, again by Facebook, with the release of Presto in 2013. Presto bypasses map-reduce to return query results in seconds. Unlike other fast SQL on Hadoop solutions, Presto is battle-proven having run on Facebook’s Internet-scale datasets processing Petabytes of data, and running thousands of queries every day. Presto as a Service is available on Qubole to aid interactive data exploration and analytics. It is indispensable for ad-hoc, quick analytics, e.g. when business users need answers to unusual, emerging questions or when exploring the data for new ETL steps. Presto is a new technology with tremendous potential and continues to evolve. For example, its pluggable data store architecture is designed to integrate with any type of data store in the future making it a polyglot persistence tool allowing businesses to store data in the best-suited data store types without worrying about accessing the data later for analytics and ETL.
How to do advanced data processing
Lastly, with growing know-how from the previous steps, businesses extend the commonly used tools in the Hadoop ecosystem, like Pig and Hive, with user-defined functions, and small programs are written to be integrated with Pig and Hive processes to extend their functionality. Eventually, businesses find special use-cases where these high-level tools reach their limits. Often these include machine learning, e.g. combining the different data sources to build models to predict sales, stock levels, and advertising campaigns. At this point traditional Hadoop programs can be employed, e.g. written in Java with Crunch, to solve these advanced tasks.
Importantly, Qubole provides the ability to run these programs on the same infrastructure the previously mentioned tools and services use. This is significant because of two aspects. Firstly, the upgrade path emerging from increased know-how and sophistication of the data processing is clear and available without additional cost. Secondly, the new processes can leverage the extensive ETL processing and datasets built by then. New advanced processes can immediately access the master data and be integrated with the data pipeline in place.
This article started as a high-level use case focused on pressures on e-commerce businesses and how to alleviate them with modern big data services like Qubole. The service approach highlights many immediate and long-term benefits. Advanced large-scale, integrating data processing can be started without any expert knowledge. All tools required are available from data integration for import and export through DbTaps, to scheduling, and multiple tools for the transformation of data. Advanced analytics can be achieved with Hive and Presto. And finally, a clear path for advanced data processing and machine learning is available when business evolved their data processing and obtain the necessary know-how. All this is open to businesses without capital investment and an operational architecture that can seamlessly grow with their demands.
Try out Qubole for free for 15-days without the need for a credit card today.
