Running Large distributed Apache Spark clusters in the public cloud, that handle the exponential increase in volumes of data to fuel analytics and Machine Learning (ML) applications, calls for a user experience that streamlines debugging, so it is easier and more efficient.
Logs are a key interface between the user and the application, but navigating logs to debug Spark applications can be difficult, due to a variety of reasons, most notably:
- Some long-running Spark applications end up generating many logs. Scanning through gigabytes of logs to find the one conspicuous line is a herculean task.
- When applications are running in the cloud, in order to drive operational/cost excellence Clusters are run ephemerally and often use remnant compute instances like AWS Spot. Finding relevant logs in these dynamic environments amplifies the complexity.
The Qubole user interface already includes a simplified debugging experience through features like highlights and filters of error level logs. However, this approach does not fully resolve the complexity of analyzing Spark application logs for efficient debugging.
In this blog, we introduce our new data-driven log analyzer, “Logan.” It can learn log patterns from past runs and from current runs to identify anomalous messages. This component is also integrated into the Qubole Analyze and Zeppelin Notebooks interfaces across all clouds.
Introducing Logan
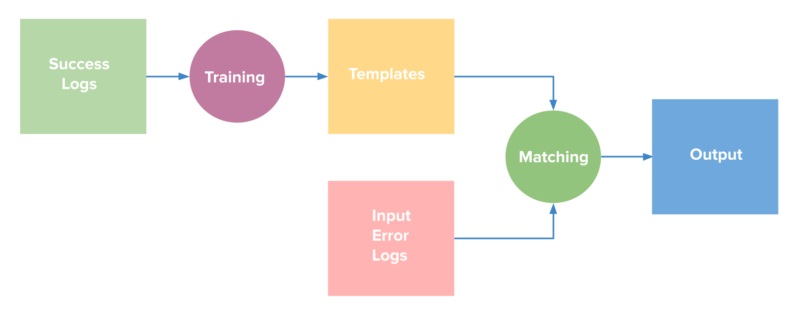
Logan is a powerful log analyzer that can process gigabytes of historic logs. Logan identifies a small set of log templates, which capture the logs that occur most commonly in a Spark application. These templates are then used to determine the relevance of a logline in future applications. Each log line generated by the application at run time is matched with these templates and a decision is taken to either retain or reject the logline based on match percentage. The following figure sums up the approach:
Figure 1: Simplified overview of the anomaly detection process using Logan.
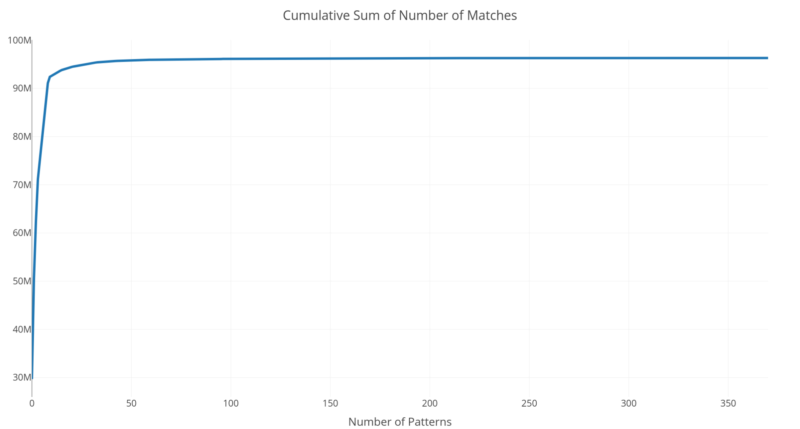
Interestingly, we found that the top 20 templates typically generate more than 90% of the messages. This allows our simple model with just about 20 templates to perform exceptionally well with an almost negligible memory footprint.

Figure 2: Cumulative sum of a number of matches for 96 million Spark log messages when templates are arranged in descending order of matches. Notice that the curve flattens with well under 50 patterns/templates
The filtering templates in Logan are generated as a combination of offline batch training and online learning process as described below:
- At Qubole, our internal data science and ETL workloads launch hundreds of Spark applications every day. We used logs from these jobs to learn the base patterns for Logan. Large training data is instrumental for learning a filtering model that can generalize over the thousands of unique workloads that run on Qubole every day. While doing this we developed a novel log parsing technique with a state-of-the-art performance which is up to 30x faster than previous works reported in academia.
- Each user-written Spark application generates some unique log lines, which are not recognized by Logan’s base filtering model. Such log lines can spam the filtered output. For these scenarios, Logan also has a built-in online learning algorithm. While filtering the log lines Logan captures the essential statistics about the lines that don’t match any pre-existing template. Logan learns these templates on the fly and employs them to filter subsequent lines in the same application. Default base templates are not updated with these user application-specific patterns.
Please check out our publications at the International Conference on Data Engineering and International Conference on Big Data for more details on training algorithms.
How Logan Works with Spark on Qubole
We have implemented a lightweight log4j appender based on Logan which is silently attached to the Qubole Spark application at run time. This appender process logs line by line as they are generated by the Spark application and filters them to create a new log file with extension .logan. This approach makes sure that the logan file is auto-generated for every spark job run in Qubole, users don’t have to make any changes to their jobs.
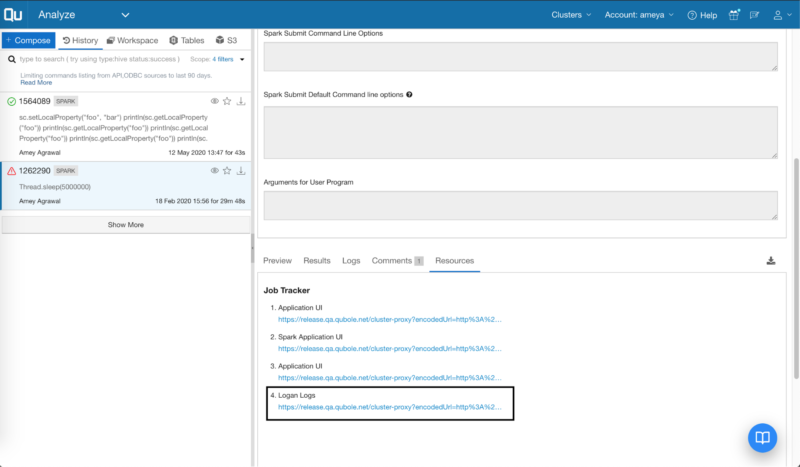
If you are running Spark version 2.4 or later on Qubole, you can find a link to Logan output in the resources section in Analyze as shown in the image below.

Figure 3: Using Logan with Spark Commands on Analyze.
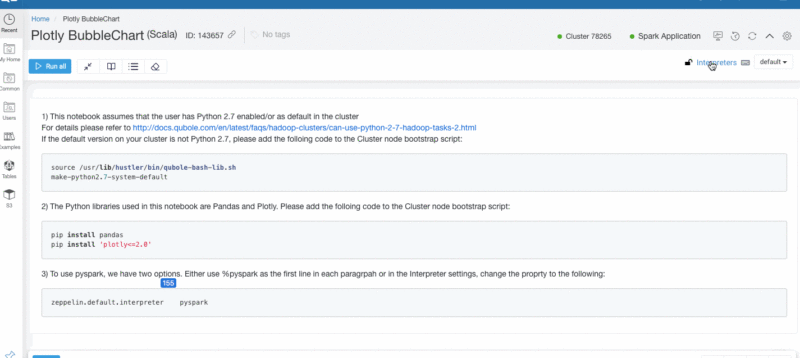
Similarly, you can find Logan output in the logs directory while using Zeppelin notebooks.

Figure 4: Using Logan with Zeppelin notebooks.
At the time of this writing, we processed 7.1 Billion log lines from user workloads and filtered out 95.2% of log lines on average. By drastically decreasing the time spent investigating logs, we have helped many customers debug their issues faster.
Summary
Logan is part of a wider effort at Qubole to help our users maximize their productivity. In the same spirit, we have previously built SparkLens and StreamingLens which help to optimize configurations of Spark applications. We also plan to open-source the code for Logan soon on Qubole’s GitHub repository. Stay tuned to keep up to date with our future projects.


